Report no. 2 · English summary
Inflation in the Dominican Republic
Prices, causes and management, 2000-2026
Between December 1999 and December 2025, consumer prices in the Dominican Republic multiplied by 6.2. This report measures that inflation month by month with Central Bank files: how much prices rose, when, what drove them and how each government fared.
Starting point
Inflation is the economic figure people check every day, at the corner store, at the gas station and on the electricity bill, and the least measured. This report took the Central Bank's consumer price index month by month since 2000, along with its series of core inflation, groups of goods and services, tradable goods, the monetary policy rate and the exchange rate, and compared it with eleven other Latin American countries.
Key findings
| Finding | Data |
|---|---|
| Prices multiplied by six | By 6.2 between December 1999 and December 2025: 7.3 % a year. What cost RD$1,000 in December 1999 costs RD$6,372 in August 2026 |
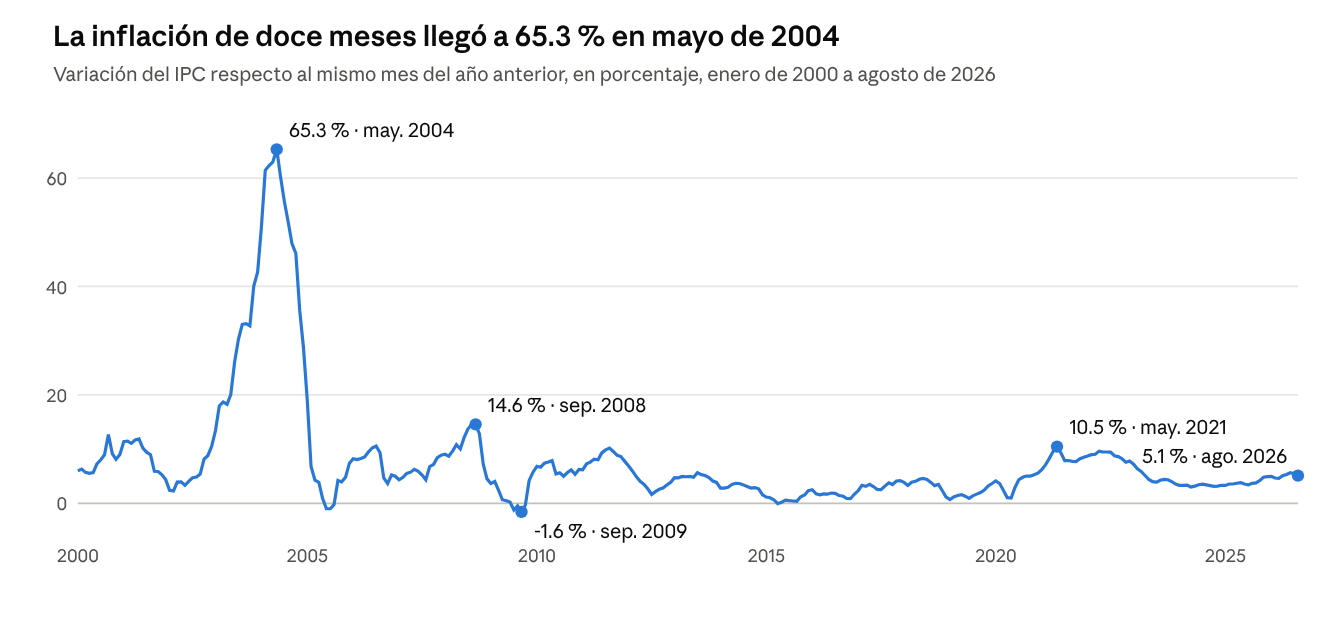
| Two years explain the difference | Inflation was 42.7 % in 2003 and 28.7 % in 2004. The twelve-month peak was 65.3 %, in May 2004 |
| Single-digit inflation since 2005 | 4.8 % a year between December 2004 and December 2025; 4.0 % since December 2011 |
| There were two other spikes | 14.6 % in September 2008 and 10.5 % in May 2021, with rising world oil and food prices |
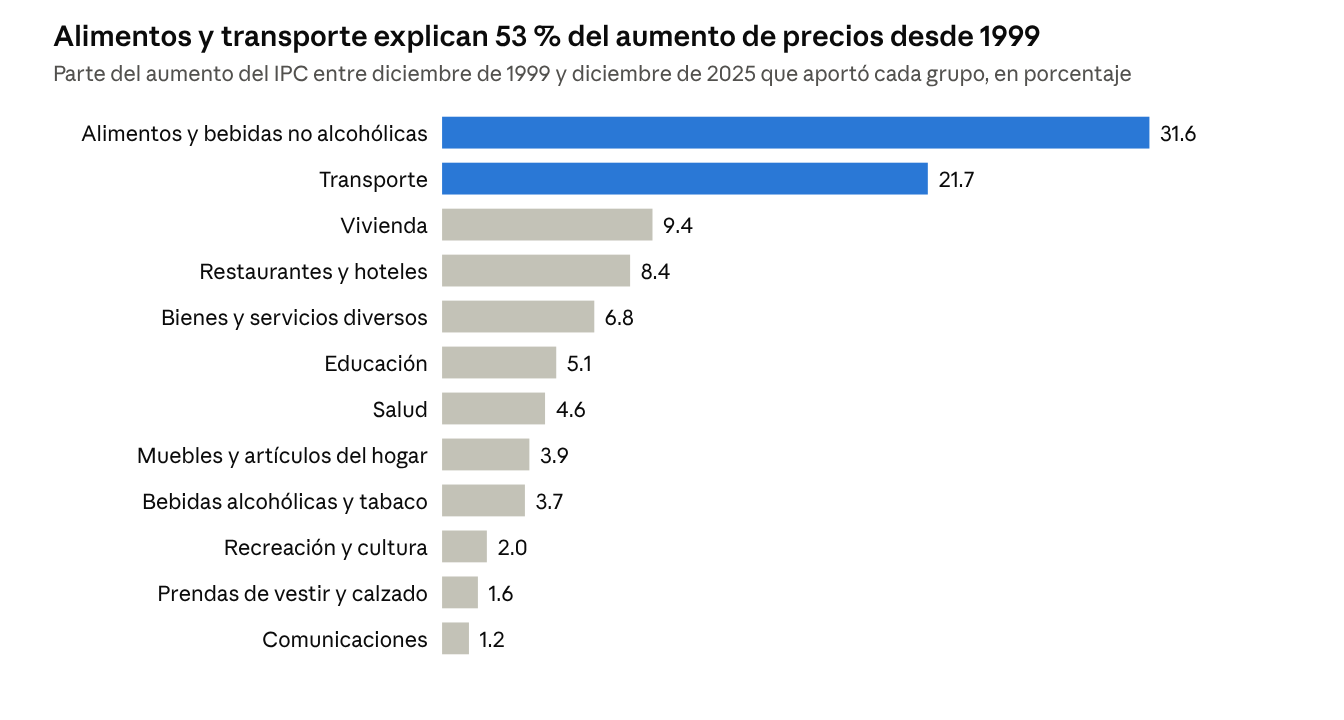
| Food and transport move the index | They weigh 40.5 % of the basket and contributed 53 % of the price increase since 1999 |
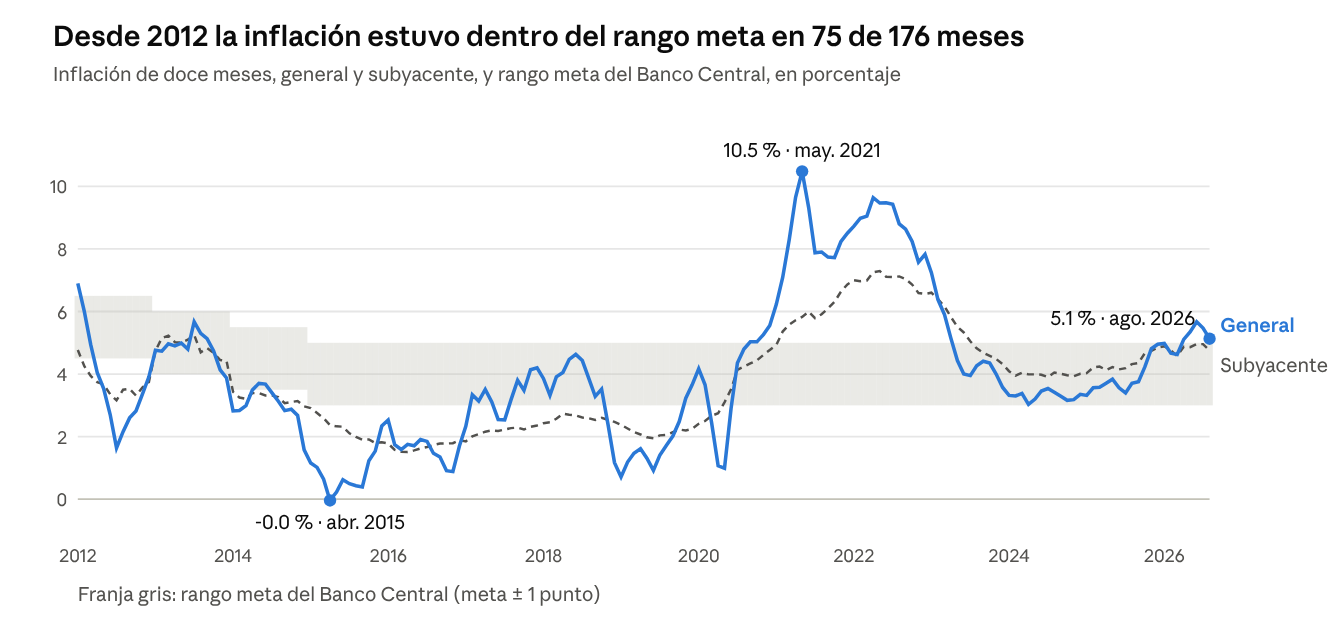
| Core inflation is more stable | Since 2012 it ranged between 1.5 % and 7.3 %; headline inflation, between 0.0 % and 10.5 % |
| The target is met less than half the time | Since 2012 inflation was within the target range in 75 of 176 months; 63 below and 38 above |
| Each government had different inflation | Per year, September to August: Mejía 23.3 %, Fernández 5.5 %, Medina 3.0 %, Abinader 5.5 % |
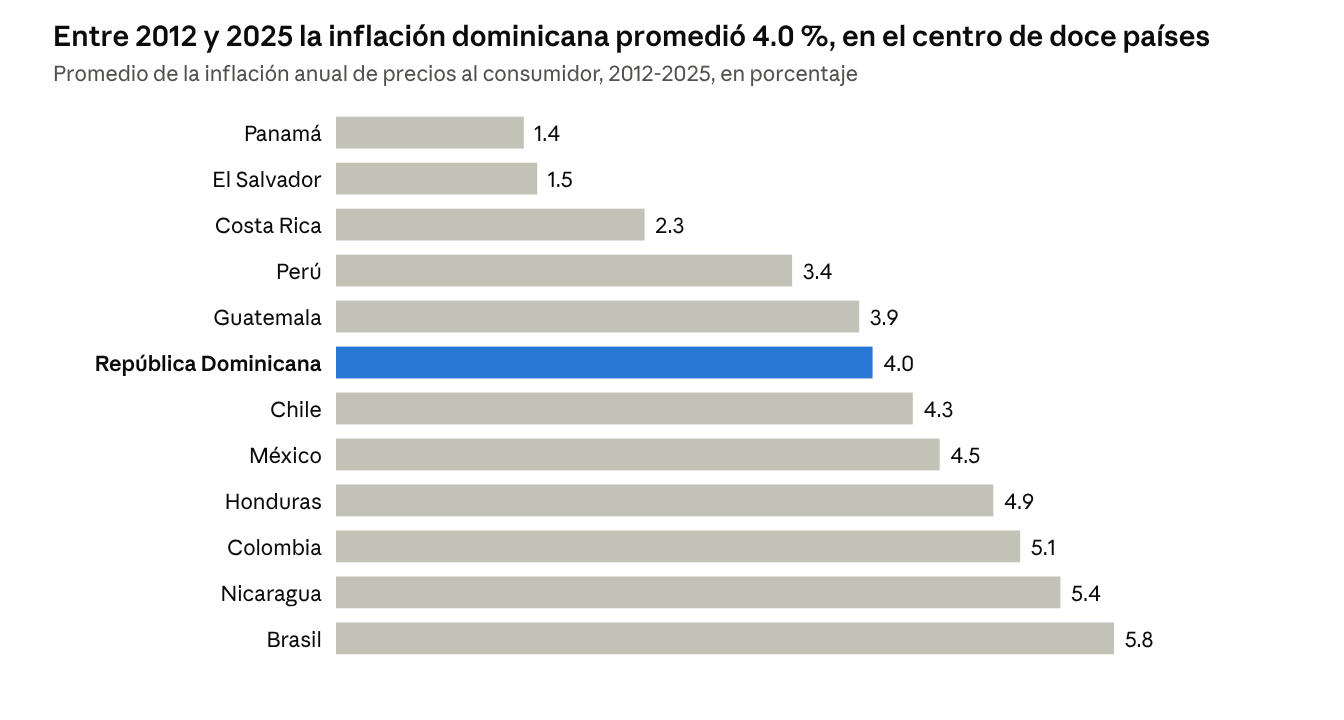
| From last place to the middle | Among twelve countries, it had the highest inflation in 2000-2011 (12.1 %) and the sixth lowest in 2012-2025 (4.0 %) |
| Today it is above the top of the target | 5.13 % in August 2026, the fifth month in a row above 5 %. The monetary policy rate rose to 5.50 % in October |
Charts from the report
Contents
| Part | Content |
|---|---|
| I. The measure | What the CPI is, its basket and how to read it |
| II. The facts | The full series and its extremes: 2003-2004, 2008, 2021-2022 and the lows |
| III. The causes | Components, core inflation and the drivers: the dollar, oil and food |
| IV. The management | Monetary policy and inflation under each government, 2000-2026 |
| V. The comparison | The Dominican Republic compared with eleven countries in the region, and conclusions |
Data files (CSV, column names in Spanish)
- Twelve-month inflation, January 2000 to August 2026inflacion_12_meses_2000_2026.csv
- Annual headline, core, tradable and non-tradable inflation, 2000-2025inflacion_anual_2000_2025.csv
- Headline and core inflation, target and monetary policy rate, 2012-2026inflacion_meta_tpm_2012_2026.csv
- Weight, increase and contribution of each CPI group, 1999-2025aporte_por_grupo_1999_2025.csv
- Inflation and the dollar by government period, 2000-2026inflacion_por_gobierno_2000_2026.csv
- Average inflation in twelve Latin American countries, 2000-2025inflacion_regional_2000_2025.csv
How to cite
Economía con Datos (2026). La inflación en República Dominicana: Precios, causas y manejo, 2000-2026 [Inflation in the Dominican Republic: Prices, causes and management, 2000-2026]. Report no. 2. Santo Domingo. https://economiacondatos.org/informes/inflacion-republica-dominicana/